
Over the course of the years, I’ve shared how we’ve been increasing our spending with portfolio growth. Not unsurprisingly, this has garnered some criticism.
Statistically speaking, the 4% rule is flawed and is designed to fail! Scary!
This is a terrible idea! You are going to be begging for spare change when you are 80!
Increasing spending with growth is misguided and sharing this with GCC readers is irresponsible!
It seems that people interested in early retirement are a naturally conservative bunch.
My perspective, which I will irresponsibly share once again:
You will die before you run out of money.
You Will Die Before You Run Out of Money
Throughout the years of our early retirement and world travel, we have increased our spending by about 3x.
In the beginning years, we spent very little as we lived large in parts of the world where you can spend very little while living large. We were intentionally spending much less than 4% so our portfolio could continue to grow. It’s a core principle in our spending plan.
Funny thing, when you continue to LBYM so your portfolio can continue to grow, it sometimes continues to grow.
And when it grows, you can spend it.
Portfolio Longevity
For some time now, I have wanted to share a really cool retirement visualization tool. The following charts are all via the Post-Retirement Calculator on Engaging-Data.com. I use a 90/10 stock/bond portfolio with 0.05% expense ratio throughout.
Let’s say you robotically follow the 4% Rule as espoused in the Trinity Study, which states you can spend an inflation-adjusted 4% of your initial portfolio value every year for at least 30 years.
Historically, this had a ~96% success rate. In the worst of times your wallet would be empty. “Designed to fail” some people say.
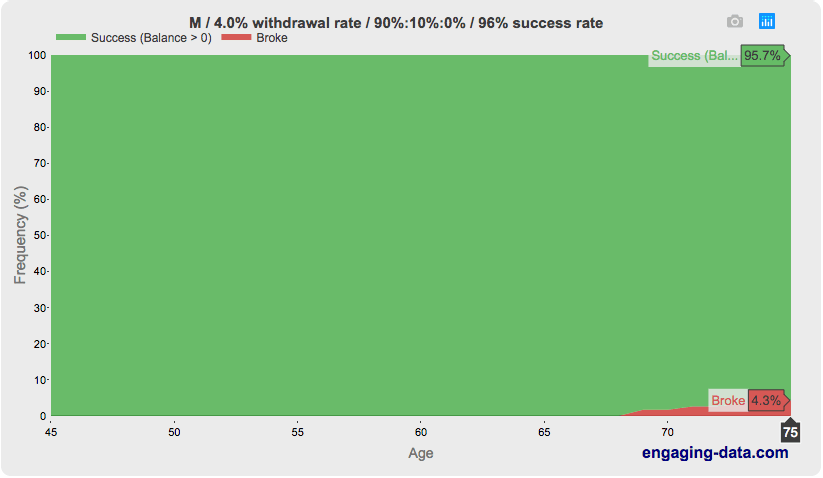
30 Year Retirement – Red = Broke. Green = Not Broke – Source
The failure rate is higher if you intend to have a much longer retirement. Sometimes a portfolio survived for 30 years but not longer.
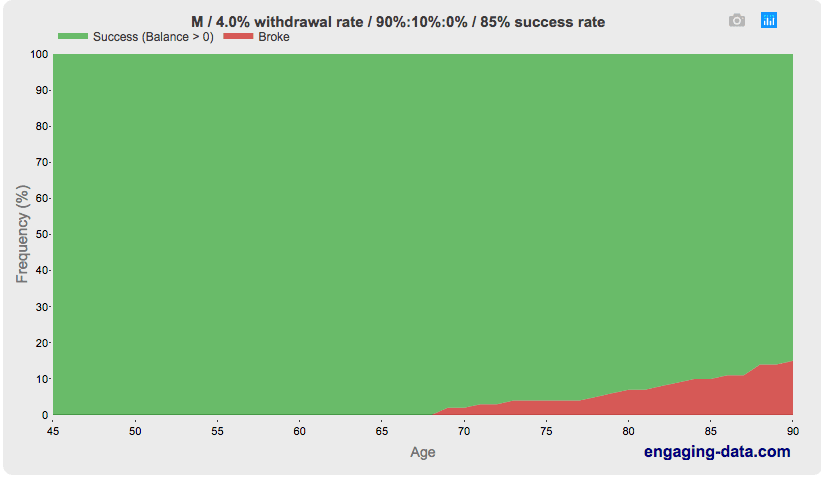
Some portfolios last 30 years but not 45 (X-axis extended) – Source
But, Other Income
As I explored in the post, Spending Future Social Security Income Now, receiving Social Security boosts success rates. More money is mo money. Even 25 years from eligibility, the effect is significant.
With average Social Security starting Age 62 ($1500/month) – Source
Begging for change will have to wait until at least Age 84.
Not All Success is Equal
Focusing on that slim sliver of red is a popular hobby. But what about all of that green?
Often times, spending 4% means spending too little. Whether this is the case or not is fairly clear within the first 10 years.
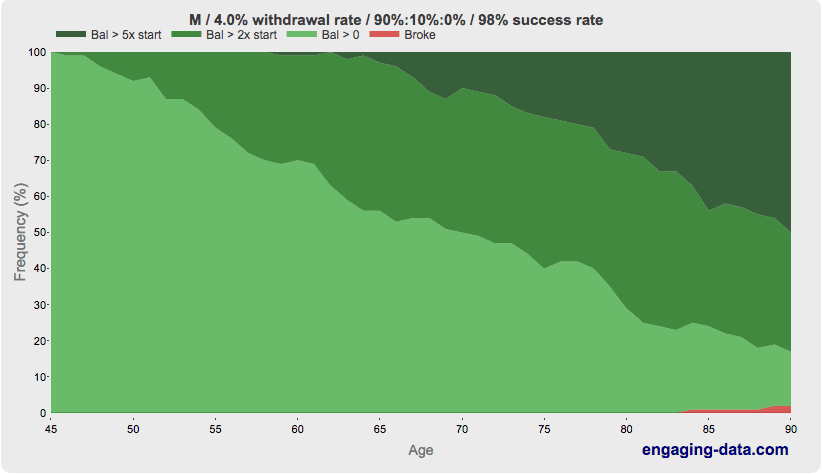
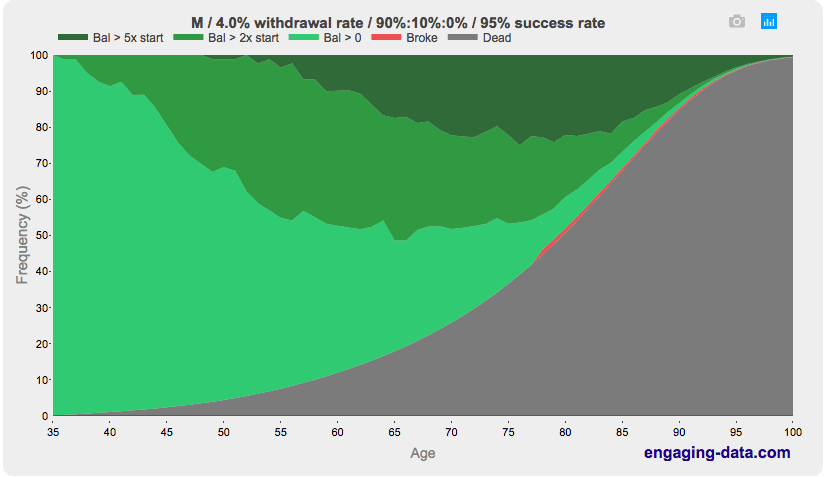
4 out 5 cases have 2x. 2 out of 4 cases have 5x. – Source
In 4 out of 5 cases, we will hit our 45th year of retirement with 2x as much money as we started with. In 2 out of 4 cases, we will have 5x as much.
Why die with an extra million or five, when you can spend some of it here and now? This is all that happens when somebody chooses to increase spending when the portfolio grows. No big deal.
One More Year Syndrome
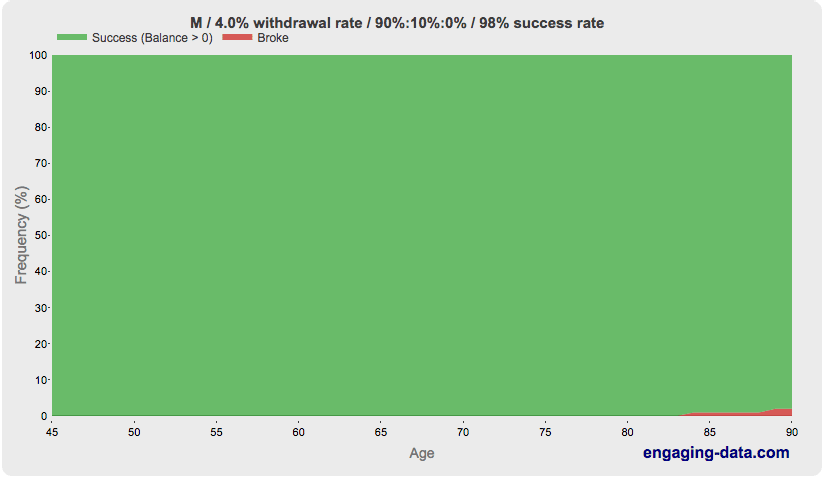
If a 98% historical success rate isn’t sufficient, we could improve our chances by working another year.
In this chart, the success rate is improved to 99% by waiting for one year before starting to make withdrawals. This is about the same benefit as spending 1% less in years where the portfolio value is less than the starting value (Spending Flexibility = 1%.)
Is the improvement in success rate because we saved more? Because the portfolio grew while we waited?
Nope. It is because we die having enjoyed fewer retirement years and are one year closer to Social Security. (Start withdrawing from same portfolio value at Age 46 vs 45)

1 More Year – Source
I worked 3 years longer than necessary in order to be able to spend more later. It’s a fine approach. It boosts savings and increases future SS income.
Historically, to grow a portfolio from 25x target spend (4%) to 33x target spend (3%) took around 3-5 years, but as long as 11 additional years. The returns diminish quickly.
Longevity Failure
Speaking of death, this is where the Engaging-Data tool makes this whole early retirement thing real.
Where is the red failure line now? How much time should we spend focusing on it?
Til Death Do Us Part – Source
Perspective
Early retirement is an inherently risky endeavor. Nothing is guaranteed.
There are certainly extenuating circumstances:
Maybe we will live longer than average.
Maybe we will have excessive health care or long term care expenses.
Maybe this time is worse than the worst time to retire in history.
Maybe.
But it is with 100% certainty that our time on Earth is short. (See how you will die.)
The thin red line of possible portfolio failure seems much less important from this perspective.
Enjoy the ride.
Conclusion
The 4% Rule is incredibly robust. Social Security makes it even more so.
If you are fortunate to be in the strong majority case where your portfolio grows 2x or 5x throughout life, there is no issue with spending some of that now. It’s fairly clear within the first 10 years if this is the case.
It is tempting to focus on the extreme nuances of a retirement withdrawal plan, trying to find the perfect solution.
But the future is unknown. It helps to view this from the perspective or our own mortality. We are far more likely to die rich than to run out of money.
Thank you to Engaging Data for making it possible to easily visualize the possibilities from this more human perspective.
—
To conclude, here are some immortal words from a legend who didn’t get to enjoy his own retirement.
Life is what happens to you while you’re busy making other plans
– John Lennon, amongst others
And an amazing music video
Do you realize
that everyone you know someday will die
– The Flaming Lips


100% agreed. If your SWR is reasonable to begin with, you are far more likely to die rich than to run out of money. Maybe 3-6x your starting amount. Also, people are far more flexible and resilient than they think. You are NOT going to wake up one Tuesday in 2046 and realize you just ran out of money. You will naturally adapt, you will adjust over the years. In a down year you will visit Mexico or Thailand and not London or Paris. You will delay a car purchase by just one year so the market recovers. Maybe you’ll earn $1,000 tutoring kids somewhere. Etc. “The reports of my running out of money are greatly exaggerated.”
Well said. Every word of it true.
Also, the general idea of spending the exact same amount every year for the next 50+ years is a bit ridiculous at face value. I’ve yet to spend the same amount 2 years in a row, let alone 5 decades. Some years will be lower, especially if motivated by poor economic conditions.
I love that lyric in that Flaming Lips song! Another great post, needed by those who worry too much and need a reminder of what’s important. I still have 5 more years to work, but I am enjoying the ride, traveling once a year to Europe (hello Prague in 45 days). My dad died when I was 15, he was 62 and worked until the day he had a heart attack. This had a profound affect on my outlook on life, I believe in mini-retirements every year… I’ve been to 12 countries and use almost all my vacay time each year. Can’t take it with you! Thanks for writing, Jeremy, I love your blog & especially your wittiness!! 😆
Thank you :)
The Flaming Lips are really amazing live. I’ve seen them twice and they do an incredible show. That would be a great thing to put on the mini-retirement list.
Yoshomi rocks!
I really wish my dad would understand this. He’s 66, still working, and keeps arguing that cash will protect him. What’s 700k in cash gonna do except lose value :(
A fascinating thing (to me) is with 25x your annual spending in cash, if you just put it in a savings account earning the equivalent of inflation you are good for 25 years, in theory.
Perhaps he views his life expectancy to be average, will spend capital over that period, and expects to receive an adequate pension should capital be exhausted.
Age 66 USA life expectancy 19.55 y. $700k / 20 = $35k / y.
The investment horizon of a 66 year old is around 15 to 20 years. Having double capital at age 86 will make little difference to quality of life in Australia where government services are good to excellent but may make a significant difference in USA where health costs can bankrupt.
Isn’t it odd what we learn to fear? I don’t know the statistics, but I’m guessing there is a much higher probability in someone dying in a car crash on their drive to work and that risk increases each day they spend in the office. Add texting or checking email or whatever else people do on their phones these days and I’m pretty sure we are risking death inherently more than we have a chance of running out of money using a 5 or 6% withdrawal rate!
I actually enjoy my job and have about as much flexibility as one could as for, but my fear is I will cut the cord too early because even with a near perfect gig, I am CHOMPING AT THE BIT to get my time back! I’m ok with that though, because I know I’ll make more money one day. Not because I’ll have to, but I’ve spent the majority of my adult life working for a large corporation and I’ve always thought it would be fun to help s start up get off it’s feet. I don’t know which one or it what industry, but I have no doubt I’ll run into it when I’m not longer chained to my cubicle.
Fear is a powerful motivator for inaction. Just picture yourself lonely and destitute in your 80s and it makes that high-stress cubicle job much more palatable :)
I also really enjoyed my job. Most of the time. I would have liked it even more if I could have done it 6 months on / 6 months off. It’s hard to do other rewarding things when the job consumes all.
If companies would focus on worker happiness and flexibility, not their incessant and irrational need to control employees, my guess is their bottom line would be much better. Not economically rational actors IMHO.
I like my job, too, but the parts I can’t control and scheduling issues will drive me out sooner rather than later.
“It’s hard to do other rewarding things when the job consumes all.” Touche. As the president of the “One-more-year because I love my job” support group, we thank you. This entire post helps keep things in perspective, thanks!
I agree that the chart which includes risk of death kind of blows away the whole 4% nitpicking.
I guess there are examples of people that have had portfolio failure for example people who’ve involuntarily retired when they lost their job in 2009. And then they started to spend down the 401K – incurring tax penalty . It’s still uncertain to me whether those people really cut way back on their spending or just assumed that they could continue on an expensive lifestyle because they would get a job in a year or less – only to discover that the job they had was never coming back.
Yeah, that chart is totally in your face.
It would have been emotionally challenging to live through the first 10-15 years if we had retired in 1965. Thinking, “at least I’ll die soon” probably wouldn’t help. But then you adapt in different ways.
What is sobering about that calculator is the average person that reads this probably puts 90 or 95 as the end date of retirement planning but if you look at the chart 50% of us will be dead at 80 and at 90 85% of us will be dead. Maybe we should be putting 80 as the end date which makes the odds of success much higher.
Very eye opening chart. Life is so short. We never know how much time has been given to us. Seeing how much more likely dying than running out of money is really made me reconsider the whole 4% rule.
With a bit of flexibility, you can easily make it a 5% rule. As you’ve said, once you have the first few years of data after retiring (sequence of returns risk), you can make smart decisions about how much to spend or if you want to go back to work.
I found this very motivating to hurry up and become FI ASAP. I was aiming for age 40, but now I think 35 may be a better FI goal with continuing to work until 40 as a “fat FIRE” goal. Life is far too short to waste it on spreadsheets and working in an office.
I love the Flaming Lips video at the end.
A reminder of our mortality is always a good thing.
Have you checked out Big ERN’s safe withdrawal series? I have a hard time squaring his conclusion with that of this calculator. My takeaway is that the 4% rule isn’t nearly as safe as it seems for early retirees, especially with CAPE north of 30, and that something like 3.25 or maybe 3.5% is supported.
Early Retirement is inherently risky, as the future is unknowable.
So what to do about that?
We can use the past as a guide; “What would have worked before?”
That gives us the 4% Rule.
Now, there were some real shit-hit-the-fan scenarios in the past, which people respond to in at least 2 different ways:
A) OK, that’s good to know. I can work with that.
B) Are you f#$king kidding me? This is my life we are talking about, I need a guarantee that this early retirement thing will work!
For the A-type personality, there are only a few things anyone needs to read:
Any summary of the 4% Rule (here is mine)
Kitces’ May 2008 newsletter; tldr: when CAPE is high, you can spend 4.5%. When CAPE is low, you can spend more than 4.5%.
A play by play of the worst time to retire in history (also mine)
Kitces’ review of 1999 and 2008 starting dates – what would you do in Year 5?
There is no right or wrong answer here, just different tools to help people make an important life decision.
For the B-type personalities, it can be comforting to really dig into the nitty-gritty details of that thin red line of portfolio failure.
It doesn’t change anything about our inability to know the future, but it is a fun bit of mathematical masturbation. If it makes you feel good, then do it. If it makes you feel shallow and alone, then don’t.
In the end, the pros/cons are irrelevant. B-types will probably work longer and spend less no matter what (just in case.) This has the multifold benefit of:
1 – the portfolio doesn’t need to last as long
2 – pessimism reduces life expectancy (see #1)
re: CAPE
CAPE as reported today (~30) is about 15-20% too high. Accounting and payout ratio changes have distorted the math.
See here and here.
As such, as of Sep 2018 Prof. Shiller has started sharing a different CAPE, the Total Return CAPE. In the brief moment I looked at it, I think it accounts for the dividend/buyback distortion but not the accounting changes.
In any case, CAPE today should be around 24 if we are fairly comparing to other points in history.
Which, when you plug into those fancy variable withdrawal strategies and include SS puts you at a withdrawal rate of at least 4%.
So: reconciliation.
The end.
Thanks for writing this Jeremy.
The 100% death rate will have a much bigger effect on everyone’s wealth
than the difference between a 3.573% and 4.015% withdrawal rate.
Only one is guaranteed.
Why does the sequence of returns in the first 10 years of retirement matter the most? Why not 5 or 15 or any length of time?
Thanks.
I have the same question!
I was referring to a quote from a Wade Pfau paper
“…the wealth remaining 10 years after retirement, combined with the cumulative inflation during those 10 years, can explain 80 percent of the variation in a retiree’s maximum sustainable withdrawal rate after 30 years”
This is just correlation math. The real (inflation-adjusted) value of the portfolio after 10 years explains why some historical periods supported a 9.5% withdrawal rate vs a 3.5% withdrawal rate. You either have a difficult path ahead (4% of the cases) or will have a hospital with your name on it (80% of cases.)
When we extend this to 50+ year retirements, the delta in withdrawal rate between a portfolio that survives 30 years and one that survives forever is small.
I’m not sure if I like your boundless optimism. :)
I’m getting a lot more conservative these days, for some reason.
The calculator seems overly optimistic. I guess it used 10% ROI or something like that.
Including death seems like a good idea. Anyway, having some money left after I’m gone is okay with me.
It uses the same data as cFIREsim. Links to the source data are in the post.
Even with spending more, there will still be a lot of money left over when we pass.
Could I piggy back off of Rick’s question above and ask what sequence of returns your first 8-10 years we are realistically looking for? How could I calculate a outcome/recommendation based on different ranges of returns for the first 10 years?
Another good one. Almost no early retirees have your insouciance. That alone will probably add like 15 years to your lifespan!!!
Not if my wife kills me first. For the same reason. ;)
This post retirement calculator that you are sharing with us on this article is fantastic! I LOVE IT :-) Can you however confirm that it used the same underlying data that the one based on the Trinity study?
It uses the Shiller data, same as cFIREsim. And more or less the same as Trinity Study. Links to the source data are in the calculator post.
Great post! Your posts and Root of Good’s are always so positive, they make me truly believe the journey is worth it:) Unfortunately our human nature (amygdala) rewards us a lot more for avoiding pain, than pursuing pleasure (especially long-term pleasure). Most would rather “grin and bare it” a year longer at work, than realize the real threat that death will come more quickly than they planned. However our adaptability as younger retirees, is our true super power. I refer to the monte carlo site, very often when I get a little anxious:) https://www.retirementsimulation.com/
Toughing it out for a year or two can be worth it. For decades, not so much.
If something doesn’t change with healthcare in the US then no amount of savings the avg person does is going to help so it might be better to just enjoy your healthy years and not worry about covering that 600k bill when you are 78 because either way you are screwed.
I believe the President proposed cutting $1 trillion from Medicare yesterday, so there is that. Otherwise, Seniors are pretty well taken care of health care wise. It is the years pre-Medicare where the risk lies.
Seniors who live or travel abroad full-time get nothing from Medicare (ImI currently in Mexico, formerly in Canada). Some Medicare Advantage plans will provide emergency coverage for the first 60 days outside the US, but “traditional” Medicare provides zip. Something to consider…
Yes. Fortunately, quality health insurance outside the US is reasonably priced.
Nice tool. But useless for an actual retiree today:
1: Kick out all the historical windows that are completely irrelevant for today’s situation (i.e., bottom or close to the bottom of a major bear market, CAPE Ratio <15, etc.) and you'll see much higher failure rates.
2: Instead of doing the cutoffs for 0, 1x, 2x and 5x it would be much more informative to look at a 0.5x and/or 0.7x (or somewhere around there) over time. A ton of cohorts that eventually made it (not ran out of money) still suffered scary drawdowns only a few years into retirement. That would be a quasi-failure because not knowing about the future, people would have cut expenses and/or gone back to work in real-time. If you add those "type 2 errors" you'll have a much worse failure rate.
Excluding data and redefining target outcomes are 2 great ways to lie with statistics.
Ah ! Funny !
Ha, good one! I love the book “How to Lie With Statistics!” Including how to lie with statistics by confusing conditional and unconditional probabilities. Wade Pfau, Todd Tressider, yours truly and many others have pointed out the importance of conditioning SWRs on initial equity valuations. So, being called a liar on this one is actually a badge of honor! :)
Honestly, it’s probably not that hard for most of us to pad FIRE with some income, which it seems nearly everyone is able to and does. Just like SS, even an extra 30k a year makes a huge difference, and most of the FIRE crowd can and does seem to make that much, or more, from blogging or other pursuits. The less employable are probably not FIREing, after all.
Great post.
One thing I forgot to add is- do not underestimate the amount of money you might need to spend on out of pocket medical expenses. I can happily live on 30k a year, but there are plenty of medications, interventions, and other medical expenses that insurance doesn’t pay for. If you get a chronic disease, it can really add up, to the tune of hundreds of thousands.
And that’s not just the US. Want the latest, fanciest cancer drug? The NHS isn’t paying for it. Neither is New Zealand. Proton therapy instead of radiation? Out of pocket. Air transport in the US? Insurance nearly always rejects the claim. Living donor liver? Half the world doesn’t do it. Infertility? CCRM is the best, and nearly no one covers it. Out of network trauma center in the US? You are paying.
I don’t know how to account for these expenses, with or without FIRE. But they can really add up. No easy answer.
While it’s true that you don’t know how much medical services could cost, it’s also true that you don’t know what medical advancements will occur. What you CAN control and predict though is the likelihood that you will develop a chronic disease. Your lifestyle today typically determines your health tomorrow. That’s why planning for retirement isn’t just about money.
I’m trying to prioritize investments in my health as seriously as those in financial security. Of course nothing’s guaranteed, but I can already see an ROI.
Another way to look at it: the Social Security mortality tables are probably too pessimistic
I’m using this exact chart as an illustration of why we are FI. It’s in a presentation for my wife (yes I’m a dork but she prefers consolidated info), as I am the primary number cruncher in our family.
For us, at 85 (now mid 40s), we are 50% more likely to have 5x our starting number (inf adj) than to be broke, and over all we are 67% likely to be dead!
So yeah, time to start planning for the end of full time work…
Great analysis! I especially like the part about how “1 more year” means “1 less year of life,” from a rationale (FIRE) perspective.
I think those who doubt your financial situation ignore three major elements you are considering when you are making those decisions :
a. You Current Active Income from GCC Blog (https://www.gocurrycracker.com/gcc-business-review-2018/) which account for more than 70% of your annual expense in 2018 and More than 50% of 2017 expenses. that mean your portfolio has outgrown the remaining expenses.
b. You have not indicates your NetWorth so it is very difficult to come to a conclusion what is the actual withdraw rate.
c. The doubters don’t know the size of your Social Security Income or any other potential pension you have.
So judging your increasing expenses as irresponsible without accounting for all the above three elements Is quite foolish In my honest opinion.
Your opinion seems quite prudent.
We have no pension. I’ll get ~$1500/month in SS (about average) and Winnie half that starting in 18+ years. We still spend less than 4% without blog income (which will eventually go to zero.)
The reason I highlight our upward spending trajectory is that intentionally spending relatively less in the early years is my preferred method of insuring against sequence of returns risk. The effect is significant, as our average cost of living over 6 years is closer to $200/day vs our 2018 cost of $300/day.
Edit: additional point – some of our expenses exist only because of the blog (SE taxes, mailing service, hosting, etc…) and some are 1-time only (IVF.)
Thanks for the kind reply and the complement.
Not sure why you think the Blog Income will eventually go to zero ?
I hope this blog continue to prosper and provide the public a great Financial education,
Travel and Geo Arbitrage entertainment and rising income to you and your family.
Thank you kindly.
I’ll probably get bored of blogging someday and assume it will all fade to zero from there.
Hey Jeremy,
Definitely agree. Maizeman on the MMM forums created the mortality vs. running out of money data/charts, and open-sourced the code he used to generate it. Cool that that site ran with it, and made it user-friendly!
Death isn’t something to worry about. Nor is running out of money.
A question for you. This part caught my eye, regarding OMY:
“In this chart, the success rate is improved to 99% by waiting for one year before starting to make withdrawals. This is about the same benefit as spending 1% less in years where the portfolio value is less than the starting value (Spending Flexibility = 1%.)”
You’re saying if someone reduced their WR from 4% to 3.96% (since 1% of 4% is 0.0004) in “portfolio < starting value" years, that's the same as working OMY? (I'm sure you aren't saying reducing it from 4% WR to 3% WR, as that would be a a 25% cut in spending.) Where did this calculation come from? It should be very relevant how much one is making, and spending, per year–that OMY might massively increase their holdings if their savings rate is high enough. Is this just a quirk of the data/charts you're using, and not more widely applicable?
On the Post-Retirement calculator, there is an input called “Spending Flexibility.” If you enter a non-zero value (x) into that box, then in any year where the portfolio value < starting portfolio value, you spend x% less than you otherwise could per the inflation-adjusted constant spend option.I interpret that to mean, for a value of 1%, instead of spending $40k you spend $39,600. Doing so gooses the success rate, which seems like $400 well (not) spent.The comparison was to the case of working one more year but not actually saving anything. Say, retiring at age 40 or 41 with exactly $1 million.
I’m glad it’s St. Patrick’s day so I can drink green beer.
A wonderful perspective :)
I wish that I can find a study that looks at the 4% rule on a yearly basis. Let me explain. The Trinity Study looked at 4% of the initial value and then adjusts each year to inflation. If your initial amount is 1 million than your first year you pull $40k and then the next year you pull around $41.5k. I wonder what would happen if you based your 4% withdrawal on the value of your accounts on say January 1st of each year. So if your investments grow in a good year and the second year your accounts are at 1.1 million. If you pull 4% than you get $44k. Obviously this would increase the risk of running out of money but you could also decrease your withdrawal when the market does. Lets say 5 years into retirement another crash occurs and your portfolio is sitting at $950k, then you just pull out $38k. I can’t figure out how to do this on my own and I can’t find anything like this online since all the different programs are based on the inflation adjusted Trinity Study.
In that scenario, where you’re always going to withdraw 4%, you’ll never run out of money, because you’re taking a percent of what you have. Your spending might get very low though.
You can easily run scenarios like this on cFIREsim.
1MM portfolio, set spending to “% of portfolio” and choose 4%. Default everything else: 75/25 equities/bonds split, 0.18% fees, rebalance annually, 30 years, etc.
You obviously never run out of money, for the reason I stated above, but in the worst scenario your spending has to dip to $15,094 per year (from an initial 40k). Ouch.
Setting a floor/ceiling on spending might be more realistic though. Say you start with 40k spending, but won’t take more than, say, 60k (real dollars), but also need a minimum of 30k (can’t cut more than 25% of your budget). In this case you also never run out of money (and portfolio never goes below about 350k), but there are times where you’re withdrawing that 30k floor many years in a row.
The amazing thing about the internet is the free tools people just put out for us to use. Check out cFIREsim to run scenarios you are curious about. :)
Thanks Joe for that great information. I tried accessing the cFIREsim but unfortunately my work computer blocks the website. Since I am doing everything I can to reduce my expenses and reach FIRE, I just use my company computer instead of going out and buying one. I guess I should have made that connection that I would never run out of money, but I was looking at it as if the account would regain any substantial losses during a crash(sequence of return risk) if you continued pulling the 4% instead of the inflation adjustment per the Trinity Study. It sounds like it does based on your numbers but it might be a slow and lengthy process depending on how deeply your accounts drop. Once again, Thanks.
Hah. Work blocking you from researching early retirement is funny. At least they allow GCC!
Might have to use a public library or something, it’s worth running the numbers to be comfortable with your drawdown plan, if nothing else (barring something like a very secure, inflation adjusted pension covering 100% of your spending).
This is hilarious. Great answer Joe.
Robert,
A new tool just came out over at Portfolio Charts that might answer a few of your questions/hypotheticals as well.
https://portfoliocharts.com/2019/03/25/smart-retirement-planning-is-about-more-than-just-avoiding-failure/
https://portfoliocharts.com/portfolio/retirement-spending/
Have fun tinkering around with that (assuming work doesn’t block it!). :D
i wrote about our modified version of this spending plan a week or two ago. the unique thing in our house is that i’m still working at a job i don’t mind. we got a little later start on this investing thing but still amassed quite a bit of money. an unusual one-time expense came up so we’re withdrawing 2% of the portfolio this year to enhance our lives. it’s been a good 10 year run and we will enjoy 2% of our hard earned invested savings with no commitment to repeat in future years. i was going to take out 5% so the safe withdrawal police could go crazy and we could live like kings and queens for a few years! this really works well for us because we’re only 6 and 11 years from social security in our house. i think the portfolio will survive that long and i don’t want to die with millions in the bank. i invested it to eventually cash it out and spend it on life.
I think far too many ‘planners’ are obsessed with hitting the “no fail and never lose account value” scenario. They don’t take death stats into consideration, at all.
That is why the “Rich, Broke, or Dead” calculator, which you use, is so absolutely invaluable. I think it has opened the eyes of many.
As far as withdrawal rates go, I think *flexibility* is key. “Rich, Broke, or Dead” has added “spending flex/threshold” to accommodate this…and it is quite useful.
This is the most impactful evaluation of the Trinity Study I’ve come across. I saved your chart as the background on my computer! Thank you!